LnRiLWZpZWxke21hcmdpbi1ib3R0b206MC43NmVtfS50Yi1maWVsZC0tbGVmdHt0ZXh0LWFsaWduOmxlZnR9LnRiLWZpZWxkLS1jZW50ZXJ7dGV4dC1hbGlnbjpjZW50ZXJ9LnRiLWZpZWxkLS1yaWdodHt0ZXh0LWFsaWduOnJpZ2h0fS50Yi1maWVsZF9fc2t5cGVfcHJldmlld3twYWRkaW5nOjEwcHggMjBweDtib3JkZXItcmFkaXVzOjNweDtjb2xvcjojZmZmO2JhY2tncm91bmQ6IzAwYWZlZTtkaXNwbGF5OmlubGluZS1ibG9ja311bC5nbGlkZV9fc2xpZGVze21hcmdpbjowfQ==
LnRiLWhlYWRpbmcuaGFzLWJhY2tncm91bmR7cGFkZGluZzowfQ==
IC50Yi1yZXBlYXRpbmctZmllbGRfX3NreXBlX3ByZXZpZXd7cGFkZGluZzoxMHB4IDIwcHg7Ym9yZGVyLXJhZGl1czozcHg7Y29sb3I6I2ZmZjtiYWNrZ3JvdW5kOiMwMGFmZWU7ZGlzcGxheTppbmxpbmUtYmxvY2t9LnRiLXJlcGVhdGluZy1maWVsZC0tZ3JpZHtkaXNwbGF5OmdyaWQ7anVzdGlmeS1pdGVtczpjZW50ZXJ9LnRiLXJlcGVhdGluZy1maWVsZC0tZ3JpZCBpbWcsLnRiLXJlcGVhdGluZy1maWVsZC0tZ3JpZCB2aWRlb3ttYXgtd2lkdGg6MTAwJTtkaXNwbGF5OmJsb2NrO2JveC1zaGFkb3c6bm9uZSAhaW1wb3J0YW50fS50Yi1yZXBlYXRpbmctZmllbGQtLWdyaWQgaW1nLC50Yi1yZXBlYXRpbmctZmllbGQtLWdyaWQgdmlkZW97bWF4LXdpZHRoOjEwMCU7ZGlzcGxheTpibG9jaztib3gtc2hhZG93Om5vbmUgIWltcG9ydGFudH0udGItcmVwZWF0aW5nLWZpZWxkLS1jb2xsYWdle2Rpc3BsYXk6Z3JpZDtqdXN0aWZ5LWl0ZW1zOmNlbnRlcjtncmlkLXRlbXBsYXRlLWNvbHVtbnM6cmVwZWF0KDEyLCAxZnIpfS50Yi1yZXBlYXRpbmctZmllbGQtLWNvbGxhZ2UgaW1nLC50Yi1yZXBlYXRpbmctZmllbGQtLWNvbGxhZ2UgdmlkZW97bWF4LXdpZHRoOjEwMCU7ZGlzcGxheTpibG9jaztib3gtc2hhZG93Om5vbmUgIWltcG9ydGFudH0udGItcmVwZWF0aW5nLWZpZWxkLS1jYXJvdXNlbHtvcGFjaXR5OjB9LnRiLXJlcGVhdGluZy1maWVsZDpub3QoLnRiLXJlcGVhdGluZy1maWVsZC0tY3JvcCkgLnRiLXJlcGVhdGluZy1maWVsZC0tZ3JpZHthbGlnbi1pdGVtczpjZW50ZXJ9LnRiLXJlcGVhdGluZy1maWVsZC0tY3JvcCAudGItcmVwZWF0aW5nLWZpZWxkLS1ncmlkIGRpdiwudGItcmVwZWF0aW5nLWZpZWxkLS1jb2xsYWdlIGRpdiwudGItcmVwZWF0aW5nLWZpZWxkLS1jcm9wIC50Yi1yZXBlYXRpbmctZmllbGQtLWZsZXhib3ggZGl2e3dpZHRoOjEwMCV9LnRiLXJlcGVhdGluZy1maWVsZC0tY3JvcCAudGItcmVwZWF0aW5nLWZpZWxkLS1ncmlkIGRpdiBpbWcsLnRiLXJlcGVhdGluZy1maWVsZC0tY29sbGFnZSBkaXYgaW1nLC50Yi1yZXBlYXRpbmctZmllbGQtLWNyb3AgLnRiLXJlcGVhdGluZy1maWVsZC0tZmxleGJveCBkaXYgaW1ney1vLW9iamVjdC1maXQ6Y292ZXI7b2JqZWN0LWZpdDpjb3ZlcjtoZWlnaHQ6MTAwJTt3aWR0aDoxMDAlfS50Yi1yZXBlYXRpbmctZmllbGQtLWNyb3AgLmdsaWRlX19zbGlkZSBpbWd7LW8tb2JqZWN0LWZpdDpjb3ZlcjtvYmplY3QtZml0OmNvdmVyO2hlaWdodDoxMDAlICFpbXBvcnRhbnR9LnRiLXJlcGVhdGluZy1maWVsZC0tZmxleGJveHtkaXNwbGF5OmZsZXh9LnRiLXJlcGVhdGluZy1maWVsZC0tZmxleGJveCBpbWd7ZGlzcGxheTpibG9jaztib3gtc2hhZG93Om5vbmUgIWltcG9ydGFudH0udGItcmVwZWF0aW5nLWZpZWxkLS1tYXNvbnJ5Om5vdCgudGItcmVwZWF0aW5nLWZpZWxkLS1tYXNvbnJ5X3ZlcnRpY2FsKXtkaXNwbGF5OmZsZXg7ZmxleC1mbG93OnJvdyB3cmFwO21hcmdpbi1sZWZ0Oi04cHg7d2lkdGg6MTAwJX0udGItcmVwZWF0aW5nLWZpZWxkLS1tYXNvbnJ5Om5vdCgudGItcmVwZWF0aW5nLWZpZWxkLS1tYXNvbnJ5X3ZlcnRpY2FsKSAudGItcmVwZWF0aW5nLWZpZWxkLS1tYXNvbnJ5LWJyaWNre2ZsZXg6YXV0bztoZWlnaHQ6MjUwcHg7bWluLXdpZHRoOjE1MHB4O21hcmdpbjowIDhweCA4cHggMH1AbWVkaWEgb25seSBzY3JlZW4gYW5kIChtaW4td2lkdGg6IDEwMjRweCl7LnRiLXJlcGVhdGluZy1maWVsZC0tbWFzb25yeTpub3QoLnRiLXJlcGVhdGluZy1maWVsZC0tbWFzb25yeV92ZXJ0aWNhbCkgLnRiLXJlcGVhdGluZy1maWVsZC0tbWFzb25yeS1icmljazpudGgtY2hpbGQoNG4rMSl7d2lkdGg6MjUwcHh9LnRiLXJlcGVhdGluZy1maWVsZC0tbWFzb25yeTpub3QoLnRiLXJlcGVhdGluZy1maWVsZC0tbWFzb25yeV92ZXJ0aWNhbCkgLnRiLXJlcGVhdGluZy1maWVsZC0tbWFzb25yeS1icmljazpudGgtY2hpbGQoNG4rMil7d2lkdGg6MzI1cHh9LnRiLXJlcGVhdGluZy1maWVsZC0tbWFzb25yeTpub3QoLnRiLXJlcGVhdGluZy1maWVsZC0tbWFzb25yeV92ZXJ0aWNhbCkgLnRiLXJlcGVhdGluZy1maWVsZC0tbWFzb25yeS1icmljazpudGgtY2hpbGQoNG4rMyl7d2lkdGg6MTgwcHh9LnRiLXJlcGVhdGluZy1maWVsZC0tbWFzb25yeTpub3QoLnRiLXJlcGVhdGluZy1maWVsZC0tbWFzb25yeV92ZXJ0aWNhbCkgLnRiLXJlcGVhdGluZy1maWVsZC0tbWFzb25yeS1icmljazpudGgtY2hpbGQoNG4rNCl7d2lkdGg6MzgwcHh9fUBtZWRpYSBvbmx5IHNjcmVlbiBhbmQgKG1heC13aWR0aDogMTAyM3B4KSBhbmQgKG1pbi13aWR0aDogNzY4cHgpey50Yi1yZXBlYXRpbmctZmllbGQtLW1hc29ucnk6bm90KC50Yi1yZXBlYXRpbmctZmllbGQtLW1hc29ucnlfdmVydGljYWwpIC50Yi1yZXBlYXRpbmctZmllbGQtLW1hc29ucnktYnJpY2s6bnRoLWNoaWxkKDRuKzEpe3dpZHRoOjIwMHB4fS50Yi1yZXBlYXRpbmctZmllbGQtLW1hc29ucnk6bm90KC50Yi1yZXBlYXRpbmctZmllbGQtLW1hc29ucnlfdmVydGljYWwpIC50Yi1yZXBlYXRpbmctZmllbGQtLW1hc29ucnktYnJpY2s6bnRoLWNoaWxkKDRuKzIpe3dpZHRoOjI1MHB4fS50Yi1yZXBlYXRpbmctZmllbGQtLW1hc29ucnk6bm90KC50Yi1yZXBlYXRpbmctZmllbGQtLW1hc29ucnlfdmVydGljYWwpIC50Yi1yZXBlYXRpbmctZmllbGQtLW1hc29ucnktYnJpY2s6bnRoLWNoaWxkKDRuKzMpe3dpZHRoOjEyMHB4fS50Yi1yZXBlYXRpbmctZmllbGQtLW1hc29ucnk6bm90KC50Yi1yZXBlYXRpbmctZmllbGQtLW1hc29ucnlfdmVydGljYWwpIC50Yi1yZXBlYXRpbmctZmllbGQtLW1hc29ucnktYnJpY2s6bnRoLWNoaWxkKDRuKzQpe3dpZHRoOjI4MHB4fX0udGItcmVwZWF0aW5nLWZpZWxkLS1tYXNvbnJ5Om5vdCgudGItcmVwZWF0aW5nLWZpZWxkLS1tYXNvbnJ5X3ZlcnRpY2FsKSAudGItcmVwZWF0aW5nLWZpZWxkLS1tYXNvbnJ5LWJyaWNrIGltZywudGItcmVwZWF0aW5nLWZpZWxkLS1tYXNvbnJ5Om5vdCgudGItcmVwZWF0aW5nLWZpZWxkLS1tYXNvbnJ5X3ZlcnRpY2FsKSAudGItcmVwZWF0aW5nLWZpZWxkLS1tYXNvbnJ5LWJyaWNrIGlmcmFtZSwudGItcmVwZWF0aW5nLWZpZWxkLS1tYXNvbnJ5Om5vdCgudGItcmVwZWF0aW5nLWZpZWxkLS1tYXNvbnJ5X3ZlcnRpY2FsKSAudGItcmVwZWF0aW5nLWZpZWxkLS1tYXNvbnJ5LWJyaWNrIHZpZGVvey1vLW9iamVjdC1maXQ6Y292ZXI7b2JqZWN0LWZpdDpjb3Zlcjt3aWR0aDoxMDAlICFpbXBvcnRhbnQ7aGVpZ2h0OjEwMCUgIWltcG9ydGFudDtkaXNwbGF5OmJsb2NrfS50Yi1yZXBlYXRpbmctZmllbGQtLW1hc29ucnk6bm90KC50Yi1yZXBlYXRpbmctZmllbGQtLW1hc29ucnlfdmVydGljYWwpIC5lZGl0b3ItYmxvY2stbGlzdF9fYmxvY2stZWRpdCAudGItcmVwZWF0aW5nLWZpZWxkLS1tYXNvbnJ5LWJyaWNre2hlaWdodDoxMzBweH0udGItcmVwZWF0aW5nLWZpZWxkLS1tYXNvbnJ5Om5vdCgudGItcmVwZWF0aW5nLWZpZWxkLS1tYXNvbnJ5X3ZlcnRpY2FsKSAuZWRpdG9yLWJsb2NrLWxpc3RfX2Jsb2NrLWVkaXQgLnRiLXJlcGVhdGluZy1maWVsZC0tbWFzb25yeS1icmljazpudGgtY2hpbGQoNG4rMSl7d2lkdGg6MTUwcHh9LnRiLXJlcGVhdGluZy1maWVsZC0tbWFzb25yeTpub3QoLnRiLXJlcGVhdGluZy1maWVsZC0tbWFzb25yeV92ZXJ0aWNhbCkgLmVkaXRvci1ibG9jay1saXN0X19ibG9jay1lZGl0IC50Yi1yZXBlYXRpbmctZmllbGQtLW1hc29ucnktYnJpY2s6bnRoLWNoaWxkKDRuKzIpe3dpZHRoOjE4MHB4fS50Yi1yZXBlYXRpbmctZmllbGQtLW1hc29ucnk6bm90KC50Yi1yZXBlYXRpbmctZmllbGQtLW1hc29ucnlfdmVydGljYWwpIC5lZGl0b3ItYmxvY2stbGlzdF9fYmxvY2stZWRpdCAudGItcmVwZWF0aW5nLWZpZWxkLS1tYXNvbnJ5LWJyaWNrOm50aC1jaGlsZCg0biszKXt3aWR0aDo5MHB4fS50Yi1yZXBlYXRpbmctZmllbGQtLW1hc29ucnk6bm90KC50Yi1yZXBlYXRpbmctZmllbGQtLW1hc29ucnlfdmVydGljYWwpIC5lZGl0b3ItYmxvY2stbGlzdF9fYmxvY2stZWRpdCAudGItcmVwZWF0aW5nLWZpZWxkLS1tYXNvbnJ5LWJyaWNrOm50aC1jaGlsZCg0bis0KXt3aWR0aDoyMTBweH0udGItcmVwZWF0aW5nLWZpZWxkLS1tYXNvbnJ5LnRiLXJlcGVhdGluZy1maWVsZC0tbWFzb25yeV92ZXJ0aWNhbHtkaXNwbGF5OmdyaWQ7Z3JpZC1yb3ctZ2FwOjA7Z3JpZC1hdXRvLXJvd3M6MXB4fS50Yi1yZXBlYXRpbmctZmllbGQtLW1hc29ucnkudGItcmVwZWF0aW5nLWZpZWxkLS1tYXNvbnJ5X3ZlcnRpY2FsIC50Yi1icmlja19fY29udGVudCBpbWcsLnRiLXJlcGVhdGluZy1maWVsZC0tbWFzb25yeS50Yi1yZXBlYXRpbmctZmllbGQtLW1hc29ucnlfdmVydGljYWwgLnRiLWJyaWNrX19jb250ZW50IGlmcmFtZSwudGItcmVwZWF0aW5nLWZpZWxkLS1tYXNvbnJ5LnRiLXJlcGVhdGluZy1maWVsZC0tbWFzb25yeV92ZXJ0aWNhbCAudGItYnJpY2tfX2NvbnRlbnQgdmlkZW97LW8tb2JqZWN0LWZpdDpjb3ZlcjtvYmplY3QtZml0OmNvdmVyO3dpZHRoOjEwMCUgIWltcG9ydGFudDtoZWlnaHQ6MTAwJSAhaW1wb3J0YW50O2Rpc3BsYXk6YmxvY2t9LnRiLXJlcGVhdGluZy1maWVsZCAuZ2xpZGV7cG9zaXRpb246cmVsYXRpdmV9LnRiLXJlcGVhdGluZy1maWVsZCAuZ2xpZGVfX3NsaWRle2hlaWdodDphdXRvfS50Yi1yZXBlYXRpbmctZmllbGQgLmdsaWRlX19zbGlkZSBpbWd7d2lkdGg6MTAwJTtmbG9hdDpub25lICFpbXBvcnRhbnR9LnRiLXJlcGVhdGluZy1maWVsZCAuZ2xpZGVfX3ZpZXd7d2lkdGg6MTAwJTt0cmFuc2l0aW9uOm9wYWNpdHkgMzUwbXMgZWFzZS1pbi1vdXR9LnRiLXJlcGVhdGluZy1maWVsZCAuZ2xpZGVfX3ZpZXcgaW1ney1vLW9iamVjdC1maXQ6Y29udGFpbjtvYmplY3QtZml0OmNvbnRhaW47d2lkdGg6MTAwJTtmbG9hdDpub25lICFpbXBvcnRhbnR9LnRiLXJlcGVhdGluZy1maWVsZCAuZ2xpZGVfX3ZpZXctLWZhZGUtb3V0e29wYWNpdHk6MH0udGItcmVwZWF0aW5nLWZpZWxkIC5nbGlkZV9fdmlldy0tZmFkZS1pbntvcGFjaXR5OjF9LnRiLXJlcGVhdGluZy1maWVsZCAuZ2xpZGVfX2Fycm93e2JvcmRlcjpub25lO3Bvc2l0aW9uOmFic29sdXRlO3otaW5kZXg6MTA7dG9wOjUwJTtkaXNwbGF5OmlubGluZS1mbGV4O2p1c3RpZnktY29udGVudDpjZW50ZXI7YWxpZ24taXRlbXM6Y2VudGVyO3dpZHRoOjQwcHg7aGVpZ2h0OjQwcHg7dGV4dC1hbGlnbjpjZW50ZXI7cGFkZGluZzowO2N1cnNvcjpwb2ludGVyO3RyYW5zZm9ybTp0cmFuc2xhdGVZKC01MCUpO29wYWNpdHk6MDtib3JkZXItcmFkaXVzOjUwcHg7dHJhbnNpdGlvbjphbGwgMC4ycyBsaW5lYXI7YmFja2dyb3VuZDpyZ2JhKDI1NSwyNTUsMjU1LDAuNyl9LnRiLXJlcGVhdGluZy1maWVsZCAuZ2xpZGVfX2Fycm93OmZvY3Vze291dGxpbmU6bm9uZTtib3gtc2hhZG93OjAgMCA1cHggIzY2NjtiYWNrZ3JvdW5kOnJnYmEoMjU1LDI1NSwyNTUsMC43KTtvcGFjaXR5OjF9LnRiLXJlcGVhdGluZy1maWVsZCAuZ2xpZGVfX2Fycm93OmhvdmVye2JhY2tncm91bmQ6cmdiYSgyNTUsMjU1LDI1NSwwLjkpfS50Yi1yZXBlYXRpbmctZmllbGQgLmdsaWRlX19hcnJvdy0tbGVmdHtsZWZ0OjVweH0udGItcmVwZWF0aW5nLWZpZWxkIC5nbGlkZV9fYXJyb3ctLWxlZnQgc3Zne21hcmdpbi1sZWZ0Oi0xcHh9LnRiLXJlcGVhdGluZy1maWVsZCAuZ2xpZGVfX2Fycm93LS1sZWZ0IHNwYW4udGItc2xpZGVyLWxlZnQtYXJyb3d7ZGlzcGxheTppbmxpbmUtYmxvY2s7d2lkdGg6MjVweDtoZWlnaHQ6MjVweDtiYWNrZ3JvdW5kLWltYWdlOnVybCgiZGF0YTppbWFnZS9zdmcreG1sLCUzQ3N2ZyB4bWxucz0naHR0cDovL3d3dy53My5vcmcvMjAwMC9zdmcnIHZpZXdCb3g9JzAgMCAxMjkgMTI5JyB3aWR0aD0nMjUnIGhlaWdodD0nMjUnJTNFJTNDZyUzRSUzQ3BhdGggZD0nbTcwLDkzLjVjMC44LDAuOCAxLjgsMS4yIDIuOSwxLjIgMSwwIDIuMS0wLjQgMi45LTEuMiAxLjYtMS42IDEuNi00LjIgMC01LjhsLTIzLjUtMjMuNSAyMy41LTIzLjVjMS42LTEuNiAxLjYtNC4yIDAtNS44cy00LjItMS42LTUuOCwwbC0yNi40LDI2LjRjLTAuOCwwLjgtMS4yLDEuOC0xLjIsMi45czAuNCwyLjEgMS4yLDIuOWwyNi40LDI2LjR6JyBmaWxsPSclMjM2NjYnLyUzRSUzQy9nJTNFJTNDL3N2ZyUzRSIpfS50Yi1yZXBlYXRpbmctZmllbGQgLmdsaWRlX19hcnJvdy0tcmlnaHR7cmlnaHQ6NXB4fS50Yi1yZXBlYXRpbmctZmllbGQgLmdsaWRlX19hcnJvdy0tcmlnaHQgc3Zne21hcmdpbi1yaWdodDotMXB4fS50Yi1yZXBlYXRpbmctZmllbGQgLmdsaWRlX19hcnJvdy0tcmlnaHQgc3Bhbi50Yi1zbGlkZXItcmlnaHQtYXJyb3d7ZGlzcGxheTppbmxpbmUtYmxvY2s7d2lkdGg6MjVweDtoZWlnaHQ6MjVweDtiYWNrZ3JvdW5kLWltYWdlOnVybCgiZGF0YTppbWFnZS9zdmcreG1sLCUzQ3N2ZyB4bWxucz0naHR0cDovL3d3dy53My5vcmcvMjAwMC9zdmcnIHZpZXdCb3g9JzAgMCAxMjkgMTI5JyB3aWR0aD0nMjUnIGhlaWdodD0nMjUnJTNFJTNDZyUzRSUzQ3BhdGggZD0nbTUxLjEsOTMuNWMwLjgsMC44IDEuOCwxLjIgMi45LDEuMiAxLDAgMi4xLTAuNCAyLjktMS4ybDI2LjQtMjYuNGMwLjgtMC44IDEuMi0xLjggMS4yLTIuOSAwLTEuMS0wLjQtMi4xLTEuMi0yLjlsLTI2LjQtMjYuNGMtMS42LTEuNi00LjItMS42LTUuOCwwLTEuNiwxLjYtMS42LDQuMiAwLDUuOGwyMy41LDIzLjUtMjMuNSwyMy41Yy0xLjYsMS42LTEuNiw0LjIgMCw1Ljh6JyBmaWxsPSclMjM2NjYnLyUzRSUzQy9nJTNFJTNDL3N2ZyUzRSIpfS50Yi1yZXBlYXRpbmctZmllbGQgLmdsaWRlOmhvdmVyIC5nbGlkZV9fYXJyb3csLnRiLXJlcGVhdGluZy1maWVsZCAuZ2xpZGU6Zm9jdXMgLmdsaWRlX19hcnJvd3tvcGFjaXR5OjF9ICAudGItZmllbGRbZGF0YS10b29sc2V0LWJsb2Nrcy1maWVsZD0iYmVlZjkzYmQ5M2JlZjI0ODk4YWQ1N2VjYTc1ZmI1OTMiXSB7IGZvbnQtc3R5bGU6IG5vcm1hbDtmb250LXdlaWdodDogYm9sZDt0ZXh0LWFsaWduOiBsZWZ0O2NvbG9yOiByZ2JhKCAyNTUsIDI1NSwgMjU0LCAxICk7YmFja2dyb3VuZC1jb2xvcjogcmdiYSggMzQsIDYzLCAxNTEsIDEgKTtwYWRkaW5nOiAxMHB4OyB9ICAudGItZmllbGRbZGF0YS10b29sc2V0LWJsb2Nrcy1maWVsZD0iYmVlZjkzYmQ5M2JlZjI0ODk4YWQ1N2VjYTc1ZmI1OTMiXSBhIHsgY29sb3I6IHJnYmEoIDI1NSwgMjU1LCAyNTUsIDEgKTt0ZXh0LWRlY29yYXRpb246IG5vbmU7IH0gLnRiLWZpZWxkW2RhdGEtdG9vbHNldC1ibG9ja3MtZmllbGQ9Ijc1ODllMzhjMDJjYjQyNGZlNGYxZThmODY2MzA4ODA0Il0geyBmb250LXdlaWdodDogYm9sZDt0ZXh0LWFsaWduOiBsZWZ0O2NvbG9yOiByZ2JhKCAyNTUsIDI1NSwgMjU0LCAxICk7YmFja2dyb3VuZC1jb2xvcjogcmdiYSggMTI5LCAxNzgsIDY5LCAxICk7cGFkZGluZzogMTBweDsgfSAgLnRiLWZpZWxkW2RhdGEtdG9vbHNldC1ibG9ja3MtZmllbGQ9Ijc1ODllMzhjMDJjYjQyNGZlNGYxZThmODY2MzA4ODA0Il0gYSB7IGNvbG9yOiByZ2JhKCAyNTUsIDI1NSwgMjU1LCAxICk7IH0gLnRiLWZpZWxkW2RhdGEtdG9vbHNldC1ibG9ja3MtZmllbGQ9IjM3OTBlNmYwMmI5NTZiOTYwYjM5NGNkY2FmYjdlYWQ3Il0geyBmb250LXdlaWdodDogYm9sZDt0ZXh0LWFsaWduOiBsZWZ0O2NvbG9yOiByZ2JhKCAyNTUsIDI1NSwgMjU0LCAxICk7YmFja2dyb3VuZC1jb2xvcjogcmdiYSggMjUsIDQyLCA2MSwgMSApO3BhZGRpbmc6IDEwcHg7IH0gIC50Yi1maWVsZFtkYXRhLXRvb2xzZXQtYmxvY2tzLWZpZWxkPSIzNzkwZTZmMDJiOTU2Yjk2MGIzOTRjZGNhZmI3ZWFkNyJdIGEgeyBjb2xvcjogcmdiYSggMjU1LCAyNTUsIDI1NSwgMSApOyB9IC50Yi1maWVsZFtkYXRhLXRvb2xzZXQtYmxvY2tzLWZpZWxkPSIzYjUwZGQ4ZWE1NTg5MmVmNDhmMGVlZGJlYzI2N2IyMSJdIHsgZm9udC13ZWlnaHQ6IGJvbGQ7dGV4dC1hbGlnbjogbGVmdDtjb2xvcjogcmdiYSggMjU1LCAyNTUsIDI1NCwgMSApO2JhY2tncm91bmQtY29sb3I6IHJnYmEoIDU4LCA3OSwgMTAyLCAxICk7cGFkZGluZzogMTBweDsgfSAgaDEudGItaGVhZGluZ1tkYXRhLXRvb2xzZXQtYmxvY2tzLWhlYWRpbmc9IjVhNDdkYmQxZGU2Nzg5MGJlYTczZTFkMmNlMzM2NmVmIl0gIHsgcGFkZGluZy10b3A6IDBweDttYXJnaW4tdG9wOiAwcHg7IH0gIEBtZWRpYSBvbmx5IHNjcmVlbiBhbmQgKG1heC13aWR0aDogNzgxcHgpIHsgIC50Yi1yZXBlYXRpbmctZmllbGRfX3NreXBlX3ByZXZpZXd7cGFkZGluZzoxMHB4IDIwcHg7Ym9yZGVyLXJhZGl1czozcHg7Y29sb3I6I2ZmZjtiYWNrZ3JvdW5kOiMwMGFmZWU7ZGlzcGxheTppbmxpbmUtYmxvY2t9LnRiLXJlcGVhdGluZy1maWVsZC0tZ3JpZHtkaXNwbGF5OmdyaWQ7anVzdGlmeS1pdGVtczpjZW50ZXJ9LnRiLXJlcGVhdGluZy1maWVsZC0tZ3JpZCBpbWcsLnRiLXJlcGVhdGluZy1maWVsZC0tZ3JpZCB2aWRlb3ttYXgtd2lkdGg6MTAwJTtkaXNwbGF5OmJsb2NrO2JveC1zaGFkb3c6bm9uZSAhaW1wb3J0YW50fS50Yi1yZXBlYXRpbmctZmllbGQtLWdyaWQgaW1nLC50Yi1yZXBlYXRpbmctZmllbGQtLWdyaWQgdmlkZW97bWF4LXdpZHRoOjEwMCU7ZGlzcGxheTpibG9jaztib3gtc2hhZG93Om5vbmUgIWltcG9ydGFudH0udGItcmVwZWF0aW5nLWZpZWxkLS1jb2xsYWdle2Rpc3BsYXk6Z3JpZDtqdXN0aWZ5LWl0ZW1zOmNlbnRlcjtncmlkLXRlbXBsYXRlLWNvbHVtbnM6cmVwZWF0KDEyLCAxZnIpfS50Yi1yZXBlYXRpbmctZmllbGQtLWNvbGxhZ2UgaW1nLC50Yi1yZXBlYXRpbmctZmllbGQtLWNvbGxhZ2UgdmlkZW97bWF4LXdpZHRoOjEwMCU7ZGlzcGxheTpibG9jaztib3gtc2hhZG93Om5vbmUgIWltcG9ydGFudH0udGItcmVwZWF0aW5nLWZpZWxkLS1jYXJvdXNlbHtvcGFjaXR5OjB9LnRiLXJlcGVhdGluZy1maWVsZDpub3QoLnRiLXJlcGVhdGluZy1maWVsZC0tY3JvcCkgLnRiLXJlcGVhdGluZy1maWVsZC0tZ3JpZHthbGlnbi1pdGVtczpjZW50ZXJ9LnRiLXJlcGVhdGluZy1maWVsZC0tY3JvcCAudGItcmVwZWF0aW5nLWZpZWxkLS1ncmlkIGRpdiwudGItcmVwZWF0aW5nLWZpZWxkLS1jb2xsYWdlIGRpdiwudGItcmVwZWF0aW5nLWZpZWxkLS1jcm9wIC50Yi1yZXBlYXRpbmctZmllbGQtLWZsZXhib3ggZGl2e3dpZHRoOjEwMCV9LnRiLXJlcGVhdGluZy1maWVsZC0tY3JvcCAudGItcmVwZWF0aW5nLWZpZWxkLS1ncmlkIGRpdiBpbWcsLnRiLXJlcGVhdGluZy1maWVsZC0tY29sbGFnZSBkaXYgaW1nLC50Yi1yZXBlYXRpbmctZmllbGQtLWNyb3AgLnRiLXJlcGVhdGluZy1maWVsZC0tZmxleGJveCBkaXYgaW1ney1vLW9iamVjdC1maXQ6Y292ZXI7b2JqZWN0LWZpdDpjb3ZlcjtoZWlnaHQ6MTAwJTt3aWR0aDoxMDAlfS50Yi1yZXBlYXRpbmctZmllbGQtLWNyb3AgLmdsaWRlX19zbGlkZSBpbWd7LW8tb2JqZWN0LWZpdDpjb3ZlcjtvYmplY3QtZml0OmNvdmVyO2hlaWdodDoxMDAlICFpbXBvcnRhbnR9LnRiLXJlcGVhdGluZy1maWVsZC0tZmxleGJveHtkaXNwbGF5OmZsZXh9LnRiLXJlcGVhdGluZy1maWVsZC0tZmxleGJveCBpbWd7ZGlzcGxheTpibG9jaztib3gtc2hhZG93Om5vbmUgIWltcG9ydGFudH0udGItcmVwZWF0aW5nLWZpZWxkLS1tYXNvbnJ5Om5vdCgudGItcmVwZWF0aW5nLWZpZWxkLS1tYXNvbnJ5X3ZlcnRpY2FsKXtkaXNwbGF5OmZsZXg7ZmxleC1mbG93OnJvdyB3cmFwO21hcmdpbi1sZWZ0Oi04cHg7d2lkdGg6MTAwJX0udGItcmVwZWF0aW5nLWZpZWxkLS1tYXNvbnJ5Om5vdCgudGItcmVwZWF0aW5nLWZpZWxkLS1tYXNvbnJ5X3ZlcnRpY2FsKSAudGItcmVwZWF0aW5nLWZpZWxkLS1tYXNvbnJ5LWJyaWNre2ZsZXg6YXV0bztoZWlnaHQ6MjUwcHg7bWluLXdpZHRoOjE1MHB4O21hcmdpbjowIDhweCA4cHggMH1AbWVkaWEgb25seSBzY3JlZW4gYW5kIChtaW4td2lkdGg6IDEwMjRweCl7LnRiLXJlcGVhdGluZy1maWVsZC0tbWFzb25yeTpub3QoLnRiLXJlcGVhdGluZy1maWVsZC0tbWFzb25yeV92ZXJ0aWNhbCkgLnRiLXJlcGVhdGluZy1maWVsZC0tbWFzb25yeS1icmljazpudGgtY2hpbGQoNG4rMSl7d2lkdGg6MjUwcHh9LnRiLXJlcGVhdGluZy1maWVsZC0tbWFzb25yeTpub3QoLnRiLXJlcGVhdGluZy1maWVsZC0tbWFzb25yeV92ZXJ0aWNhbCkgLnRiLXJlcGVhdGluZy1maWVsZC0tbWFzb25yeS1icmljazpudGgtY2hpbGQoNG4rMil7d2lkdGg6MzI1cHh9LnRiLXJlcGVhdGluZy1maWVsZC0tbWFzb25yeTpub3QoLnRiLXJlcGVhdGluZy1maWVsZC0tbWFzb25yeV92ZXJ0aWNhbCkgLnRiLXJlcGVhdGluZy1maWVsZC0tbWFzb25yeS1icmljazpudGgtY2hpbGQoNG4rMyl7d2lkdGg6MTgwcHh9LnRiLXJlcGVhdGluZy1maWVsZC0tbWFzb25yeTpub3QoLnRiLXJlcGVhdGluZy1maWVsZC0tbWFzb25yeV92ZXJ0aWNhbCkgLnRiLXJlcGVhdGluZy1maWVsZC0tbWFzb25yeS1icmljazpudGgtY2hpbGQoNG4rNCl7d2lkdGg6MzgwcHh9fUBtZWRpYSBvbmx5IHNjcmVlbiBhbmQgKG1heC13aWR0aDogMTAyM3B4KSBhbmQgKG1pbi13aWR0aDogNzY4cHgpey50Yi1yZXBlYXRpbmctZmllbGQtLW1hc29ucnk6bm90KC50Yi1yZXBlYXRpbmctZmllbGQtLW1hc29ucnlfdmVydGljYWwpIC50Yi1yZXBlYXRpbmctZmllbGQtLW1hc29ucnktYnJpY2s6bnRoLWNoaWxkKDRuKzEpe3dpZHRoOjIwMHB4fS50Yi1yZXBlYXRpbmctZmllbGQtLW1hc29ucnk6bm90KC50Yi1yZXBlYXRpbmctZmllbGQtLW1hc29ucnlfdmVydGljYWwpIC50Yi1yZXBlYXRpbmctZmllbGQtLW1hc29ucnktYnJpY2s6bnRoLWNoaWxkKDRuKzIpe3dpZHRoOjI1MHB4fS50Yi1yZXBlYXRpbmctZmllbGQtLW1hc29ucnk6bm90KC50Yi1yZXBlYXRpbmctZmllbGQtLW1hc29ucnlfdmVydGljYWwpIC50Yi1yZXBlYXRpbmctZmllbGQtLW1hc29ucnktYnJpY2s6bnRoLWNoaWxkKDRuKzMpe3dpZHRoOjEyMHB4fS50Yi1yZXBlYXRpbmctZmllbGQtLW1hc29ucnk6bm90KC50Yi1yZXBlYXRpbmctZmllbGQtLW1hc29ucnlfdmVydGljYWwpIC50Yi1yZXBlYXRpbmctZmllbGQtLW1hc29ucnktYnJpY2s6bnRoLWNoaWxkKDRuKzQpe3dpZHRoOjI4MHB4fX0udGItcmVwZWF0aW5nLWZpZWxkLS1tYXNvbnJ5Om5vdCgudGItcmVwZWF0aW5nLWZpZWxkLS1tYXNvbnJ5X3ZlcnRpY2FsKSAudGItcmVwZWF0aW5nLWZpZWxkLS1tYXNvbnJ5LWJyaWNrIGltZywudGItcmVwZWF0aW5nLWZpZWxkLS1tYXNvbnJ5Om5vdCgudGItcmVwZWF0aW5nLWZpZWxkLS1tYXNvbnJ5X3ZlcnRpY2FsKSAudGItcmVwZWF0aW5nLWZpZWxkLS1tYXNvbnJ5LWJyaWNrIGlmcmFtZSwudGItcmVwZWF0aW5nLWZpZWxkLS1tYXNvbnJ5Om5vdCgudGItcmVwZWF0aW5nLWZpZWxkLS1tYXNvbnJ5X3ZlcnRpY2FsKSAudGItcmVwZWF0aW5nLWZpZWxkLS1tYXNvbnJ5LWJyaWNrIHZpZGVvey1vLW9iamVjdC1maXQ6Y292ZXI7b2JqZWN0LWZpdDpjb3Zlcjt3aWR0aDoxMDAlICFpbXBvcnRhbnQ7aGVpZ2h0OjEwMCUgIWltcG9ydGFudDtkaXNwbGF5OmJsb2NrfS50Yi1yZXBlYXRpbmctZmllbGQtLW1hc29ucnk6bm90KC50Yi1yZXBlYXRpbmctZmllbGQtLW1hc29ucnlfdmVydGljYWwpIC5lZGl0b3ItYmxvY2stbGlzdF9fYmxvY2stZWRpdCAudGItcmVwZWF0aW5nLWZpZWxkLS1tYXNvbnJ5LWJyaWNre2hlaWdodDoxMzBweH0udGItcmVwZWF0aW5nLWZpZWxkLS1tYXNvbnJ5Om5vdCgudGItcmVwZWF0aW5nLWZpZWxkLS1tYXNvbnJ5X3ZlcnRpY2FsKSAuZWRpdG9yLWJsb2NrLWxpc3RfX2Jsb2NrLWVkaXQgLnRiLXJlcGVhdGluZy1maWVsZC0tbWFzb25yeS1icmljazpudGgtY2hpbGQoNG4rMSl7d2lkdGg6MTUwcHh9LnRiLXJlcGVhdGluZy1maWVsZC0tbWFzb25yeTpub3QoLnRiLXJlcGVhdGluZy1maWVsZC0tbWFzb25yeV92ZXJ0aWNhbCkgLmVkaXRvci1ibG9jay1saXN0X19ibG9jay1lZGl0IC50Yi1yZXBlYXRpbmctZmllbGQtLW1hc29ucnktYnJpY2s6bnRoLWNoaWxkKDRuKzIpe3dpZHRoOjE4MHB4fS50Yi1yZXBlYXRpbmctZmllbGQtLW1hc29ucnk6bm90KC50Yi1yZXBlYXRpbmctZmllbGQtLW1hc29ucnlfdmVydGljYWwpIC5lZGl0b3ItYmxvY2stbGlzdF9fYmxvY2stZWRpdCAudGItcmVwZWF0aW5nLWZpZWxkLS1tYXNvbnJ5LWJyaWNrOm50aC1jaGlsZCg0biszKXt3aWR0aDo5MHB4fS50Yi1yZXBlYXRpbmctZmllbGQtLW1hc29ucnk6bm90KC50Yi1yZXBlYXRpbmctZmllbGQtLW1hc29ucnlfdmVydGljYWwpIC5lZGl0b3ItYmxvY2stbGlzdF9fYmxvY2stZWRpdCAudGItcmVwZWF0aW5nLWZpZWxkLS1tYXNvbnJ5LWJyaWNrOm50aC1jaGlsZCg0bis0KXt3aWR0aDoyMTBweH0udGItcmVwZWF0aW5nLWZpZWxkLS1tYXNvbnJ5LnRiLXJlcGVhdGluZy1maWVsZC0tbWFzb25yeV92ZXJ0aWNhbHtkaXNwbGF5OmdyaWQ7Z3JpZC1yb3ctZ2FwOjA7Z3JpZC1hdXRvLXJvd3M6MXB4fS50Yi1yZXBlYXRpbmctZmllbGQtLW1hc29ucnkudGItcmVwZWF0aW5nLWZpZWxkLS1tYXNvbnJ5X3ZlcnRpY2FsIC50Yi1icmlja19fY29udGVudCBpbWcsLnRiLXJlcGVhdGluZy1maWVsZC0tbWFzb25yeS50Yi1yZXBlYXRpbmctZmllbGQtLW1hc29ucnlfdmVydGljYWwgLnRiLWJyaWNrX19jb250ZW50IGlmcmFtZSwudGItcmVwZWF0aW5nLWZpZWxkLS1tYXNvbnJ5LnRiLXJlcGVhdGluZy1maWVsZC0tbWFzb25yeV92ZXJ0aWNhbCAudGItYnJpY2tfX2NvbnRlbnQgdmlkZW97LW8tb2JqZWN0LWZpdDpjb3ZlcjtvYmplY3QtZml0OmNvdmVyO3dpZHRoOjEwMCUgIWltcG9ydGFudDtoZWlnaHQ6MTAwJSAhaW1wb3J0YW50O2Rpc3BsYXk6YmxvY2t9LnRiLXJlcGVhdGluZy1maWVsZCAuZ2xpZGV7cG9zaXRpb246cmVsYXRpdmV9LnRiLXJlcGVhdGluZy1maWVsZCAuZ2xpZGVfX3NsaWRle2hlaWdodDphdXRvfS50Yi1yZXBlYXRpbmctZmllbGQgLmdsaWRlX19zbGlkZSBpbWd7d2lkdGg6MTAwJTtmbG9hdDpub25lICFpbXBvcnRhbnR9LnRiLXJlcGVhdGluZy1maWVsZCAuZ2xpZGVfX3ZpZXd7d2lkdGg6MTAwJTt0cmFuc2l0aW9uOm9wYWNpdHkgMzUwbXMgZWFzZS1pbi1vdXR9LnRiLXJlcGVhdGluZy1maWVsZCAuZ2xpZGVfX3ZpZXcgaW1ney1vLW9iamVjdC1maXQ6Y29udGFpbjtvYmplY3QtZml0OmNvbnRhaW47d2lkdGg6MTAwJTtmbG9hdDpub25lICFpbXBvcnRhbnR9LnRiLXJlcGVhdGluZy1maWVsZCAuZ2xpZGVfX3ZpZXctLWZhZGUtb3V0e29wYWNpdHk6MH0udGItcmVwZWF0aW5nLWZpZWxkIC5nbGlkZV9fdmlldy0tZmFkZS1pbntvcGFjaXR5OjF9LnRiLXJlcGVhdGluZy1maWVsZCAuZ2xpZGVfX2Fycm93e2JvcmRlcjpub25lO3Bvc2l0aW9uOmFic29sdXRlO3otaW5kZXg6MTA7dG9wOjUwJTtkaXNwbGF5OmlubGluZS1mbGV4O2p1c3RpZnktY29udGVudDpjZW50ZXI7YWxpZ24taXRlbXM6Y2VudGVyO3dpZHRoOjQwcHg7aGVpZ2h0OjQwcHg7dGV4dC1hbGlnbjpjZW50ZXI7cGFkZGluZzowO2N1cnNvcjpwb2ludGVyO3RyYW5zZm9ybTp0cmFuc2xhdGVZKC01MCUpO29wYWNpdHk6MDtib3JkZXItcmFkaXVzOjUwcHg7dHJhbnNpdGlvbjphbGwgMC4ycyBsaW5lYXI7YmFja2dyb3VuZDpyZ2JhKDI1NSwyNTUsMjU1LDAuNyl9LnRiLXJlcGVhdGluZy1maWVsZCAuZ2xpZGVfX2Fycm93OmZvY3Vze291dGxpbmU6bm9uZTtib3gtc2hhZG93OjAgMCA1cHggIzY2NjtiYWNrZ3JvdW5kOnJnYmEoMjU1LDI1NSwyNTUsMC43KTtvcGFjaXR5OjF9LnRiLXJlcGVhdGluZy1maWVsZCAuZ2xpZGVfX2Fycm93OmhvdmVye2JhY2tncm91bmQ6cmdiYSgyNTUsMjU1LDI1NSwwLjkpfS50Yi1yZXBlYXRpbmctZmllbGQgLmdsaWRlX19hcnJvdy0tbGVmdHtsZWZ0OjVweH0udGItcmVwZWF0aW5nLWZpZWxkIC5nbGlkZV9fYXJyb3ctLWxlZnQgc3Zne21hcmdpbi1sZWZ0Oi0xcHh9LnRiLXJlcGVhdGluZy1maWVsZCAuZ2xpZGVfX2Fycm93LS1sZWZ0IHNwYW4udGItc2xpZGVyLWxlZnQtYXJyb3d7ZGlzcGxheTppbmxpbmUtYmxvY2s7d2lkdGg6MjVweDtoZWlnaHQ6MjVweDtiYWNrZ3JvdW5kLWltYWdlOnVybCgiZGF0YTppbWFnZS9zdmcreG1sLCUzQ3N2ZyB4bWxucz0naHR0cDovL3d3dy53My5vcmcvMjAwMC9zdmcnIHZpZXdCb3g9JzAgMCAxMjkgMTI5JyB3aWR0aD0nMjUnIGhlaWdodD0nMjUnJTNFJTNDZyUzRSUzQ3BhdGggZD0nbTcwLDkzLjVjMC44LDAuOCAxLjgsMS4yIDIuOSwxLjIgMSwwIDIuMS0wLjQgMi45LTEuMiAxLjYtMS42IDEuNi00LjIgMC01LjhsLTIzLjUtMjMuNSAyMy41LTIzLjVjMS42LTEuNiAxLjYtNC4yIDAtNS44cy00LjItMS42LTUuOCwwbC0yNi40LDI2LjRjLTAuOCwwLjgtMS4yLDEuOC0xLjIsMi45czAuNCwyLjEgMS4yLDIuOWwyNi40LDI2LjR6JyBmaWxsPSclMjM2NjYnLyUzRSUzQy9nJTNFJTNDL3N2ZyUzRSIpfS50Yi1yZXBlYXRpbmctZmllbGQgLmdsaWRlX19hcnJvdy0tcmlnaHR7cmlnaHQ6NXB4fS50Yi1yZXBlYXRpbmctZmllbGQgLmdsaWRlX19hcnJvdy0tcmlnaHQgc3Zne21hcmdpbi1yaWdodDotMXB4fS50Yi1yZXBlYXRpbmctZmllbGQgLmdsaWRlX19hcnJvdy0tcmlnaHQgc3Bhbi50Yi1zbGlkZXItcmlnaHQtYXJyb3d7ZGlzcGxheTppbmxpbmUtYmxvY2s7d2lkdGg6MjVweDtoZWlnaHQ6MjVweDtiYWNrZ3JvdW5kLWltYWdlOnVybCgiZGF0YTppbWFnZS9zdmcreG1sLCUzQ3N2ZyB4bWxucz0naHR0cDovL3d3dy53My5vcmcvMjAwMC9zdmcnIHZpZXdCb3g9JzAgMCAxMjkgMTI5JyB3aWR0aD0nMjUnIGhlaWdodD0nMjUnJTNFJTNDZyUzRSUzQ3BhdGggZD0nbTUxLjEsOTMuNWMwLjgsMC44IDEuOCwxLjIgMi45LDEuMiAxLDAgMi4xLTAuNCAyLjktMS4ybDI2LjQtMjYuNGMwLjgtMC44IDEuMi0xLjggMS4yLTIuOSAwLTEuMS0wLjQtMi4xLTEuMi0yLjlsLTI2LjQtMjYuNGMtMS42LTEuNi00LjItMS42LTUuOCwwLTEuNiwxLjYtMS42LDQuMiAwLDUuOGwyMy41LDIzLjUtMjMuNSwyMy41Yy0xLjYsMS42LTEuNiw0LjIgMCw1Ljh6JyBmaWxsPSclMjM2NjYnLyUzRSUzQy9nJTNFJTNDL3N2ZyUzRSIpfS50Yi1yZXBlYXRpbmctZmllbGQgLmdsaWRlOmhvdmVyIC5nbGlkZV9fYXJyb3csLnRiLXJlcGVhdGluZy1maWVsZCAuZ2xpZGU6Zm9jdXMgLmdsaWRlX19hcnJvd3tvcGFjaXR5OjF9ICAgICAgICB9IEBtZWRpYSBvbmx5IHNjcmVlbiBhbmQgKG1heC13aWR0aDogNTk5cHgpIHsgIC50Yi1yZXBlYXRpbmctZmllbGRfX3NreXBlX3ByZXZpZXd7cGFkZGluZzoxMHB4IDIwcHg7Ym9yZGVyLXJhZGl1czozcHg7Y29sb3I6I2ZmZjtiYWNrZ3JvdW5kOiMwMGFmZWU7ZGlzcGxheTppbmxpbmUtYmxvY2t9LnRiLXJlcGVhdGluZy1maWVsZC0tZ3JpZHtkaXNwbGF5OmdyaWQ7anVzdGlmeS1pdGVtczpjZW50ZXJ9LnRiLXJlcGVhdGluZy1maWVsZC0tZ3JpZCBpbWcsLnRiLXJlcGVhdGluZy1maWVsZC0tZ3JpZCB2aWRlb3ttYXgtd2lkdGg6MTAwJTtkaXNwbGF5OmJsb2NrO2JveC1zaGFkb3c6bm9uZSAhaW1wb3J0YW50fS50Yi1yZXBlYXRpbmctZmllbGQtLWdyaWQgaW1nLC50Yi1yZXBlYXRpbmctZmllbGQtLWdyaWQgdmlkZW97bWF4LXdpZHRoOjEwMCU7ZGlzcGxheTpibG9jaztib3gtc2hhZG93Om5vbmUgIWltcG9ydGFudH0udGItcmVwZWF0aW5nLWZpZWxkLS1jb2xsYWdle2Rpc3BsYXk6Z3JpZDtqdXN0aWZ5LWl0ZW1zOmNlbnRlcjtncmlkLXRlbXBsYXRlLWNvbHVtbnM6cmVwZWF0KDEyLCAxZnIpfS50Yi1yZXBlYXRpbmctZmllbGQtLWNvbGxhZ2UgaW1nLC50Yi1yZXBlYXRpbmctZmllbGQtLWNvbGxhZ2UgdmlkZW97bWF4LXdpZHRoOjEwMCU7ZGlzcGxheTpibG9jaztib3gtc2hhZG93Om5vbmUgIWltcG9ydGFudH0udGItcmVwZWF0aW5nLWZpZWxkLS1jYXJvdXNlbHtvcGFjaXR5OjB9LnRiLXJlcGVhdGluZy1maWVsZDpub3QoLnRiLXJlcGVhdGluZy1maWVsZC0tY3JvcCkgLnRiLXJlcGVhdGluZy1maWVsZC0tZ3JpZHthbGlnbi1pdGVtczpjZW50ZXJ9LnRiLXJlcGVhdGluZy1maWVsZC0tY3JvcCAudGItcmVwZWF0aW5nLWZpZWxkLS1ncmlkIGRpdiwudGItcmVwZWF0aW5nLWZpZWxkLS1jb2xsYWdlIGRpdiwudGItcmVwZWF0aW5nLWZpZWxkLS1jcm9wIC50Yi1yZXBlYXRpbmctZmllbGQtLWZsZXhib3ggZGl2e3dpZHRoOjEwMCV9LnRiLXJlcGVhdGluZy1maWVsZC0tY3JvcCAudGItcmVwZWF0aW5nLWZpZWxkLS1ncmlkIGRpdiBpbWcsLnRiLXJlcGVhdGluZy1maWVsZC0tY29sbGFnZSBkaXYgaW1nLC50Yi1yZXBlYXRpbmctZmllbGQtLWNyb3AgLnRiLXJlcGVhdGluZy1maWVsZC0tZmxleGJveCBkaXYgaW1ney1vLW9iamVjdC1maXQ6Y292ZXI7b2JqZWN0LWZpdDpjb3ZlcjtoZWlnaHQ6MTAwJTt3aWR0aDoxMDAlfS50Yi1yZXBlYXRpbmctZmllbGQtLWNyb3AgLmdsaWRlX19zbGlkZSBpbWd7LW8tb2JqZWN0LWZpdDpjb3ZlcjtvYmplY3QtZml0OmNvdmVyO2hlaWdodDoxMDAlICFpbXBvcnRhbnR9LnRiLXJlcGVhdGluZy1maWVsZC0tZmxleGJveHtkaXNwbGF5OmZsZXh9LnRiLXJlcGVhdGluZy1maWVsZC0tZmxleGJveCBpbWd7ZGlzcGxheTpibG9jaztib3gtc2hhZG93Om5vbmUgIWltcG9ydGFudH0udGItcmVwZWF0aW5nLWZpZWxkLS1tYXNvbnJ5Om5vdCgudGItcmVwZWF0aW5nLWZpZWxkLS1tYXNvbnJ5X3ZlcnRpY2FsKXtkaXNwbGF5OmZsZXg7ZmxleC1mbG93OnJvdyB3cmFwO21hcmdpbi1sZWZ0Oi04cHg7d2lkdGg6MTAwJX0udGItcmVwZWF0aW5nLWZpZWxkLS1tYXNvbnJ5Om5vdCgudGItcmVwZWF0aW5nLWZpZWxkLS1tYXNvbnJ5X3ZlcnRpY2FsKSAudGItcmVwZWF0aW5nLWZpZWxkLS1tYXNvbnJ5LWJyaWNre2ZsZXg6YXV0bztoZWlnaHQ6MjUwcHg7bWluLXdpZHRoOjE1MHB4O21hcmdpbjowIDhweCA4cHggMH1AbWVkaWEgb25seSBzY3JlZW4gYW5kIChtaW4td2lkdGg6IDEwMjRweCl7LnRiLXJlcGVhdGluZy1maWVsZC0tbWFzb25yeTpub3QoLnRiLXJlcGVhdGluZy1maWVsZC0tbWFzb25yeV92ZXJ0aWNhbCkgLnRiLXJlcGVhdGluZy1maWVsZC0tbWFzb25yeS1icmljazpudGgtY2hpbGQoNG4rMSl7d2lkdGg6MjUwcHh9LnRiLXJlcGVhdGluZy1maWVsZC0tbWFzb25yeTpub3QoLnRiLXJlcGVhdGluZy1maWVsZC0tbWFzb25yeV92ZXJ0aWNhbCkgLnRiLXJlcGVhdGluZy1maWVsZC0tbWFzb25yeS1icmljazpudGgtY2hpbGQoNG4rMil7d2lkdGg6MzI1cHh9LnRiLXJlcGVhdGluZy1maWVsZC0tbWFzb25yeTpub3QoLnRiLXJlcGVhdGluZy1maWVsZC0tbWFzb25yeV92ZXJ0aWNhbCkgLnRiLXJlcGVhdGluZy1maWVsZC0tbWFzb25yeS1icmljazpudGgtY2hpbGQoNG4rMyl7d2lkdGg6MTgwcHh9LnRiLXJlcGVhdGluZy1maWVsZC0tbWFzb25yeTpub3QoLnRiLXJlcGVhdGluZy1maWVsZC0tbWFzb25yeV92ZXJ0aWNhbCkgLnRiLXJlcGVhdGluZy1maWVsZC0tbWFzb25yeS1icmljazpudGgtY2hpbGQoNG4rNCl7d2lkdGg6MzgwcHh9fUBtZWRpYSBvbmx5IHNjcmVlbiBhbmQgKG1heC13aWR0aDogMTAyM3B4KSBhbmQgKG1pbi13aWR0aDogNzY4cHgpey50Yi1yZXBlYXRpbmctZmllbGQtLW1hc29ucnk6bm90KC50Yi1yZXBlYXRpbmctZmllbGQtLW1hc29ucnlfdmVydGljYWwpIC50Yi1yZXBlYXRpbmctZmllbGQtLW1hc29ucnktYnJpY2s6bnRoLWNoaWxkKDRuKzEpe3dpZHRoOjIwMHB4fS50Yi1yZXBlYXRpbmctZmllbGQtLW1hc29ucnk6bm90KC50Yi1yZXBlYXRpbmctZmllbGQtLW1hc29ucnlfdmVydGljYWwpIC50Yi1yZXBlYXRpbmctZmllbGQtLW1hc29ucnktYnJpY2s6bnRoLWNoaWxkKDRuKzIpe3dpZHRoOjI1MHB4fS50Yi1yZXBlYXRpbmctZmllbGQtLW1hc29ucnk6bm90KC50Yi1yZXBlYXRpbmctZmllbGQtLW1hc29ucnlfdmVydGljYWwpIC50Yi1yZXBlYXRpbmctZmllbGQtLW1hc29ucnktYnJpY2s6bnRoLWNoaWxkKDRuKzMpe3dpZHRoOjEyMHB4fS50Yi1yZXBlYXRpbmctZmllbGQtLW1hc29ucnk6bm90KC50Yi1yZXBlYXRpbmctZmllbGQtLW1hc29ucnlfdmVydGljYWwpIC50Yi1yZXBlYXRpbmctZmllbGQtLW1hc29ucnktYnJpY2s6bnRoLWNoaWxkKDRuKzQpe3dpZHRoOjI4MHB4fX0udGItcmVwZWF0aW5nLWZpZWxkLS1tYXNvbnJ5Om5vdCgudGItcmVwZWF0aW5nLWZpZWxkLS1tYXNvbnJ5X3ZlcnRpY2FsKSAudGItcmVwZWF0aW5nLWZpZWxkLS1tYXNvbnJ5LWJyaWNrIGltZywudGItcmVwZWF0aW5nLWZpZWxkLS1tYXNvbnJ5Om5vdCgudGItcmVwZWF0aW5nLWZpZWxkLS1tYXNvbnJ5X3ZlcnRpY2FsKSAudGItcmVwZWF0aW5nLWZpZWxkLS1tYXNvbnJ5LWJyaWNrIGlmcmFtZSwudGItcmVwZWF0aW5nLWZpZWxkLS1tYXNvbnJ5Om5vdCgudGItcmVwZWF0aW5nLWZpZWxkLS1tYXNvbnJ5X3ZlcnRpY2FsKSAudGItcmVwZWF0aW5nLWZpZWxkLS1tYXNvbnJ5LWJyaWNrIHZpZGVvey1vLW9iamVjdC1maXQ6Y292ZXI7b2JqZWN0LWZpdDpjb3Zlcjt3aWR0aDoxMDAlICFpbXBvcnRhbnQ7aGVpZ2h0OjEwMCUgIWltcG9ydGFudDtkaXNwbGF5OmJsb2NrfS50Yi1yZXBlYXRpbmctZmllbGQtLW1hc29ucnk6bm90KC50Yi1yZXBlYXRpbmctZmllbGQtLW1hc29ucnlfdmVydGljYWwpIC5lZGl0b3ItYmxvY2stbGlzdF9fYmxvY2stZWRpdCAudGItcmVwZWF0aW5nLWZpZWxkLS1tYXNvbnJ5LWJyaWNre2hlaWdodDoxMzBweH0udGItcmVwZWF0aW5nLWZpZWxkLS1tYXNvbnJ5Om5vdCgudGItcmVwZWF0aW5nLWZpZWxkLS1tYXNvbnJ5X3ZlcnRpY2FsKSAuZWRpdG9yLWJsb2NrLWxpc3RfX2Jsb2NrLWVkaXQgLnRiLXJlcGVhdGluZy1maWVsZC0tbWFzb25yeS1icmljazpudGgtY2hpbGQoNG4rMSl7d2lkdGg6MTUwcHh9LnRiLXJlcGVhdGluZy1maWVsZC0tbWFzb25yeTpub3QoLnRiLXJlcGVhdGluZy1maWVsZC0tbWFzb25yeV92ZXJ0aWNhbCkgLmVkaXRvci1ibG9jay1saXN0X19ibG9jay1lZGl0IC50Yi1yZXBlYXRpbmctZmllbGQtLW1hc29ucnktYnJpY2s6bnRoLWNoaWxkKDRuKzIpe3dpZHRoOjE4MHB4fS50Yi1yZXBlYXRpbmctZmllbGQtLW1hc29ucnk6bm90KC50Yi1yZXBlYXRpbmctZmllbGQtLW1hc29ucnlfdmVydGljYWwpIC5lZGl0b3ItYmxvY2stbGlzdF9fYmxvY2stZWRpdCAudGItcmVwZWF0aW5nLWZpZWxkLS1tYXNvbnJ5LWJyaWNrOm50aC1jaGlsZCg0biszKXt3aWR0aDo5MHB4fS50Yi1yZXBlYXRpbmctZmllbGQtLW1hc29ucnk6bm90KC50Yi1yZXBlYXRpbmctZmllbGQtLW1hc29ucnlfdmVydGljYWwpIC5lZGl0b3ItYmxvY2stbGlzdF9fYmxvY2stZWRpdCAudGItcmVwZWF0aW5nLWZpZWxkLS1tYXNvbnJ5LWJyaWNrOm50aC1jaGlsZCg0bis0KXt3aWR0aDoyMTBweH0udGItcmVwZWF0aW5nLWZpZWxkLS1tYXNvbnJ5LnRiLXJlcGVhdGluZy1maWVsZC0tbWFzb25yeV92ZXJ0aWNhbHtkaXNwbGF5OmdyaWQ7Z3JpZC1yb3ctZ2FwOjA7Z3JpZC1hdXRvLXJvd3M6MXB4fS50Yi1yZXBlYXRpbmctZmllbGQtLW1hc29ucnkudGItcmVwZWF0aW5nLWZpZWxkLS1tYXNvbnJ5X3ZlcnRpY2FsIC50Yi1icmlja19fY29udGVudCBpbWcsLnRiLXJlcGVhdGluZy1maWVsZC0tbWFzb25yeS50Yi1yZXBlYXRpbmctZmllbGQtLW1hc29ucnlfdmVydGljYWwgLnRiLWJyaWNrX19jb250ZW50IGlmcmFtZSwudGItcmVwZWF0aW5nLWZpZWxkLS1tYXNvbnJ5LnRiLXJlcGVhdGluZy1maWVsZC0tbWFzb25yeV92ZXJ0aWNhbCAudGItYnJpY2tfX2NvbnRlbnQgdmlkZW97LW8tb2JqZWN0LWZpdDpjb3ZlcjtvYmplY3QtZml0OmNvdmVyO3dpZHRoOjEwMCUgIWltcG9ydGFudDtoZWlnaHQ6MTAwJSAhaW1wb3J0YW50O2Rpc3BsYXk6YmxvY2t9LnRiLXJlcGVhdGluZy1maWVsZCAuZ2xpZGV7cG9zaXRpb246cmVsYXRpdmV9LnRiLXJlcGVhdGluZy1maWVsZCAuZ2xpZGVfX3NsaWRle2hlaWdodDphdXRvfS50Yi1yZXBlYXRpbmctZmllbGQgLmdsaWRlX19zbGlkZSBpbWd7d2lkdGg6MTAwJTtmbG9hdDpub25lICFpbXBvcnRhbnR9LnRiLXJlcGVhdGluZy1maWVsZCAuZ2xpZGVfX3ZpZXd7d2lkdGg6MTAwJTt0cmFuc2l0aW9uOm9wYWNpdHkgMzUwbXMgZWFzZS1pbi1vdXR9LnRiLXJlcGVhdGluZy1maWVsZCAuZ2xpZGVfX3ZpZXcgaW1ney1vLW9iamVjdC1maXQ6Y29udGFpbjtvYmplY3QtZml0OmNvbnRhaW47d2lkdGg6MTAwJTtmbG9hdDpub25lICFpbXBvcnRhbnR9LnRiLXJlcGVhdGluZy1maWVsZCAuZ2xpZGVfX3ZpZXctLWZhZGUtb3V0e29wYWNpdHk6MH0udGItcmVwZWF0aW5nLWZpZWxkIC5nbGlkZV9fdmlldy0tZmFkZS1pbntvcGFjaXR5OjF9LnRiLXJlcGVhdGluZy1maWVsZCAuZ2xpZGVfX2Fycm93e2JvcmRlcjpub25lO3Bvc2l0aW9uOmFic29sdXRlO3otaW5kZXg6MTA7dG9wOjUwJTtkaXNwbGF5OmlubGluZS1mbGV4O2p1c3RpZnktY29udGVudDpjZW50ZXI7YWxpZ24taXRlbXM6Y2VudGVyO3dpZHRoOjQwcHg7aGVpZ2h0OjQwcHg7dGV4dC1hbGlnbjpjZW50ZXI7cGFkZGluZzowO2N1cnNvcjpwb2ludGVyO3RyYW5zZm9ybTp0cmFuc2xhdGVZKC01MCUpO29wYWNpdHk6MDtib3JkZXItcmFkaXVzOjUwcHg7dHJhbnNpdGlvbjphbGwgMC4ycyBsaW5lYXI7YmFja2dyb3VuZDpyZ2JhKDI1NSwyNTUsMjU1LDAuNyl9LnRiLXJlcGVhdGluZy1maWVsZCAuZ2xpZGVfX2Fycm93OmZvY3Vze291dGxpbmU6bm9uZTtib3gtc2hhZG93OjAgMCA1cHggIzY2NjtiYWNrZ3JvdW5kOnJnYmEoMjU1LDI1NSwyNTUsMC43KTtvcGFjaXR5OjF9LnRiLXJlcGVhdGluZy1maWVsZCAuZ2xpZGVfX2Fycm93OmhvdmVye2JhY2tncm91bmQ6cmdiYSgyNTUsMjU1LDI1NSwwLjkpfS50Yi1yZXBlYXRpbmctZmllbGQgLmdsaWRlX19hcnJvdy0tbGVmdHtsZWZ0OjVweH0udGItcmVwZWF0aW5nLWZpZWxkIC5nbGlkZV9fYXJyb3ctLWxlZnQgc3Zne21hcmdpbi1sZWZ0Oi0xcHh9LnRiLXJlcGVhdGluZy1maWVsZCAuZ2xpZGVfX2Fycm93LS1sZWZ0IHNwYW4udGItc2xpZGVyLWxlZnQtYXJyb3d7ZGlzcGxheTppbmxpbmUtYmxvY2s7d2lkdGg6MjVweDtoZWlnaHQ6MjVweDtiYWNrZ3JvdW5kLWltYWdlOnVybCgiZGF0YTppbWFnZS9zdmcreG1sLCUzQ3N2ZyB4bWxucz0naHR0cDovL3d3dy53My5vcmcvMjAwMC9zdmcnIHZpZXdCb3g9JzAgMCAxMjkgMTI5JyB3aWR0aD0nMjUnIGhlaWdodD0nMjUnJTNFJTNDZyUzRSUzQ3BhdGggZD0nbTcwLDkzLjVjMC44LDAuOCAxLjgsMS4yIDIuOSwxLjIgMSwwIDIuMS0wLjQgMi45LTEuMiAxLjYtMS42IDEuNi00LjIgMC01LjhsLTIzLjUtMjMuNSAyMy41LTIzLjVjMS42LTEuNiAxLjYtNC4yIDAtNS44cy00LjItMS42LTUuOCwwbC0yNi40LDI2LjRjLTAuOCwwLjgtMS4yLDEuOC0xLjIsMi45czAuNCwyLjEgMS4yLDIuOWwyNi40LDI2LjR6JyBmaWxsPSclMjM2NjYnLyUzRSUzQy9nJTNFJTNDL3N2ZyUzRSIpfS50Yi1yZXBlYXRpbmctZmllbGQgLmdsaWRlX19hcnJvdy0tcmlnaHR7cmlnaHQ6NXB4fS50Yi1yZXBlYXRpbmctZmllbGQgLmdsaWRlX19hcnJvdy0tcmlnaHQgc3Zne21hcmdpbi1yaWdodDotMXB4fS50Yi1yZXBlYXRpbmctZmllbGQgLmdsaWRlX19hcnJvdy0tcmlnaHQgc3Bhbi50Yi1zbGlkZXItcmlnaHQtYXJyb3d7ZGlzcGxheTppbmxpbmUtYmxvY2s7d2lkdGg6MjVweDtoZWlnaHQ6MjVweDtiYWNrZ3JvdW5kLWltYWdlOnVybCgiZGF0YTppbWFnZS9zdmcreG1sLCUzQ3N2ZyB4bWxucz0naHR0cDovL3d3dy53My5vcmcvMjAwMC9zdmcnIHZpZXdCb3g9JzAgMCAxMjkgMTI5JyB3aWR0aD0nMjUnIGhlaWdodD0nMjUnJTNFJTNDZyUzRSUzQ3BhdGggZD0nbTUxLjEsOTMuNWMwLjgsMC44IDEuOCwxLjIgMi45LDEuMiAxLDAgMi4xLTAuNCAyLjktMS4ybDI2LjQtMjYuNGMwLjgtMC44IDEuMi0xLjggMS4yLTIuOSAwLTEuMS0wLjQtMi4xLTEuMi0yLjlsLTI2LjQtMjYuNGMtMS42LTEuNi00LjItMS42LTUuOCwwLTEuNiwxLjYtMS42LDQuMiAwLDUuOGwyMy41LDIzLjUtMjMuNSwyMy41Yy0xLjYsMS42LTEuNiw0LjIgMCw1Ljh6JyBmaWxsPSclMjM2NjYnLyUzRSUzQy9nJTNFJTNDL3N2ZyUzRSIpfS50Yi1yZXBlYXRpbmctZmllbGQgLmdsaWRlOmhvdmVyIC5nbGlkZV9fYXJyb3csLnRiLXJlcGVhdGluZy1maWVsZCAuZ2xpZGU6Zm9jdXMgLmdsaWRlX19hcnJvd3tvcGFjaXR5OjF9ICAgICAgICB9IA==
More Datasets
Dataset-15: AERPAW RF Sensor Measurements with UAV July 2024
Lead Experimenter
Cole Dickerson, North Carolina State University
Link to Dataset
The dataset contains TDOA localization estimates, ground-truth UAV positions, and binary LOS/NLOS indicators for each tower involved in the TDOA estimation. The dataset is available via [Dryad].
Equipment and Software Used
Keysight N6841A RF sensors on AERPAW towers LW2–5, Keysight N6854A Geolocation Software, GNU Radio, and an AERPAW UAV equipped with an SDR portable node.
Description
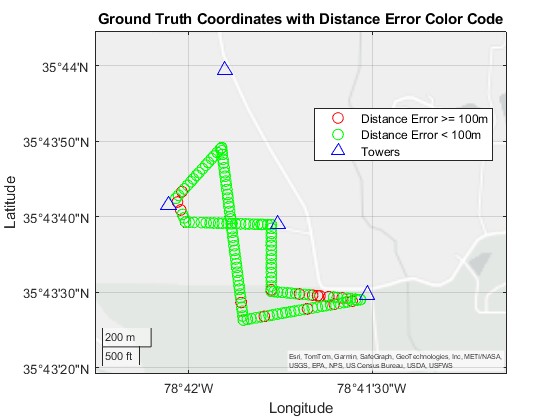
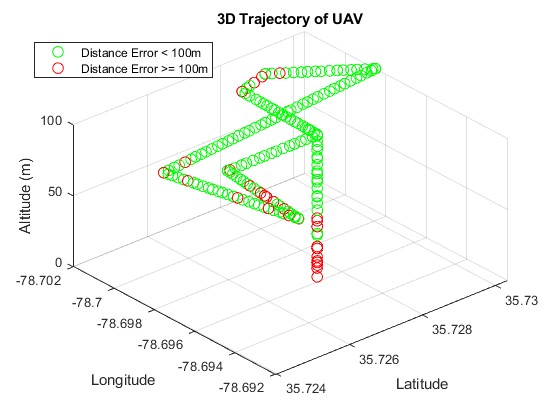
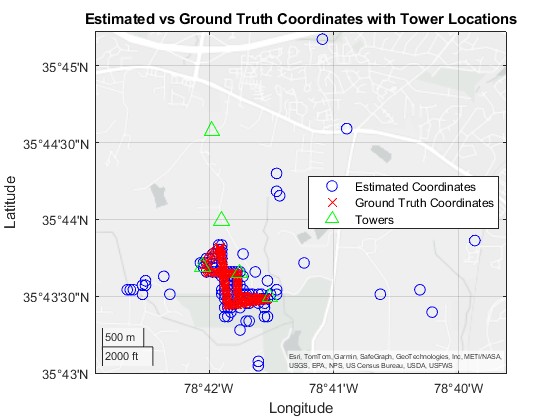
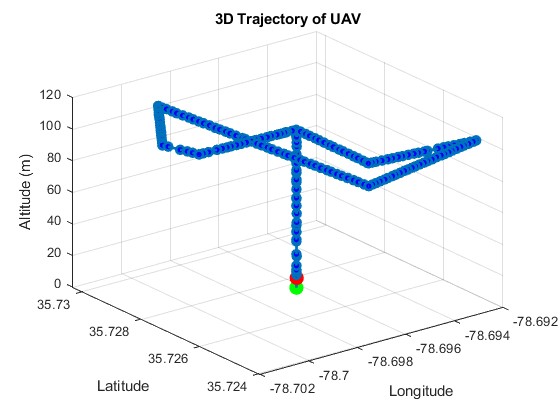
The experimental efforts for which this data was collected aimed to evaluate the performance of Time Difference of Arrival (TDOA)-based 3D localization of UAVs in real-world environments. A UAV equipped with a software-defined radio transmitted RF signals at a central frequency of 3.32 GHz, using varying bandwidths (1.25 MHz, 2.5 MHz, and 5 MHz) and altitudes (40 m, 70 m, and 100 m) over controlled flight trajectories. Four Keysight N6841A RF sensors were deployed on fixed towers to capture RF signals and process them using TDOA algorithms for position estimation. The experiments were conducted under mixed line-of-sight (LOS) and non-line-of-sight (NLOS) conditions with the additional use of ray-tracing simulations to analyze LOS/NLOS effects. These efforts sought to understand how altitude, bandwidth, and environmental factors impact UAV localization accuracy.
Publications
- C. Dickerson, S. Masrur, J. Dickerson, Ö. Özdemir and I. Güvenç, "Impact of Altitude, Bandwidth, and NLOS Bias on TDOA-Based 3D UAV Localization: Experimental Results and CRLB Analysis," 2025 IEEE International Conference on Communications Workshops (ICC Workshops), Montreal, QC, Canada, 2025, pp. 671-677, doi: 10.1109/ICCWorkshops67674.2025.11162218.
Representative Results